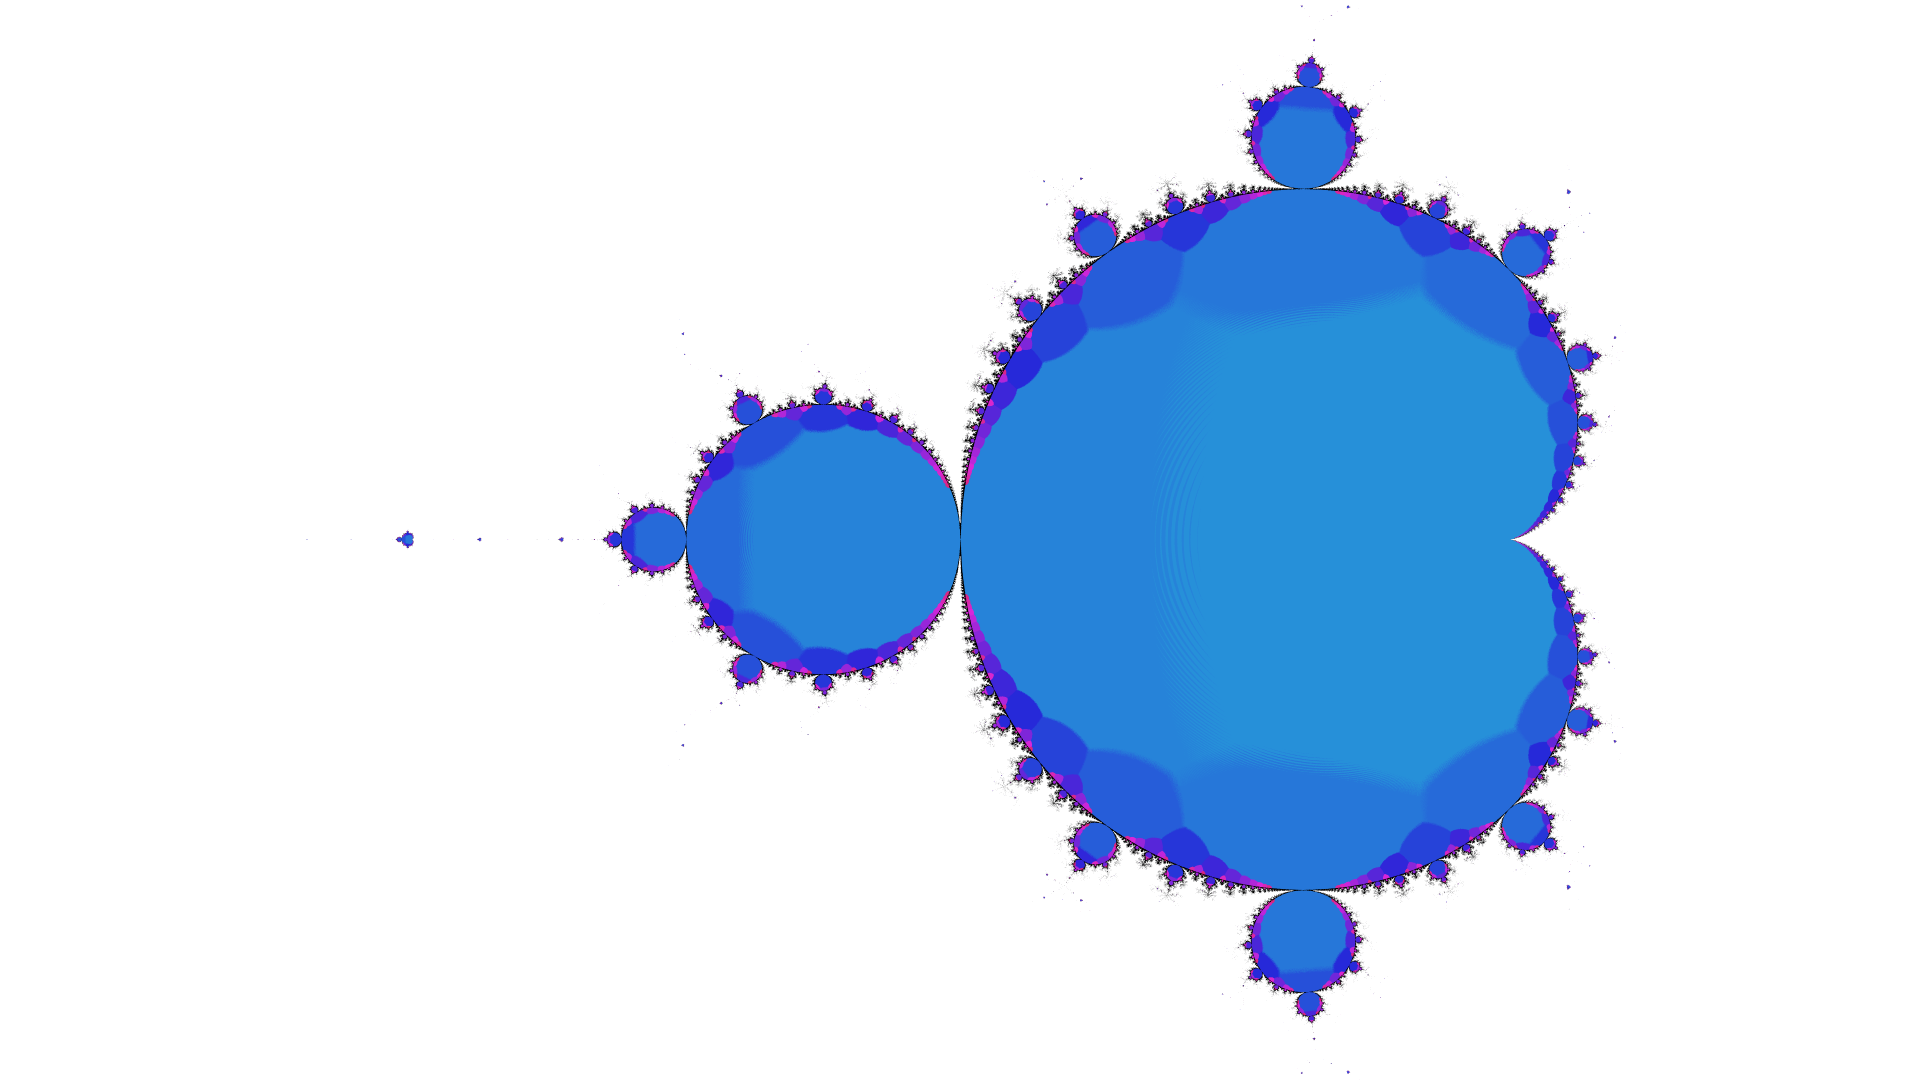
The Mandelbrot is defined as points $c$ for which the iteration of $z_{n+1} = z_{n}^2 + c$ does escape towards infinity.
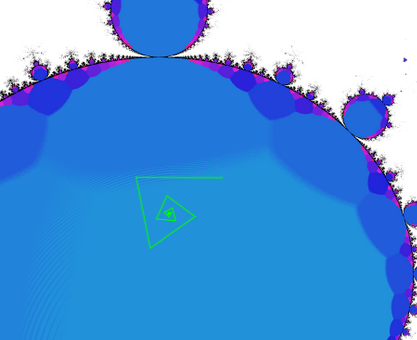
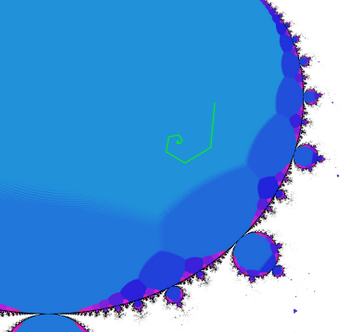
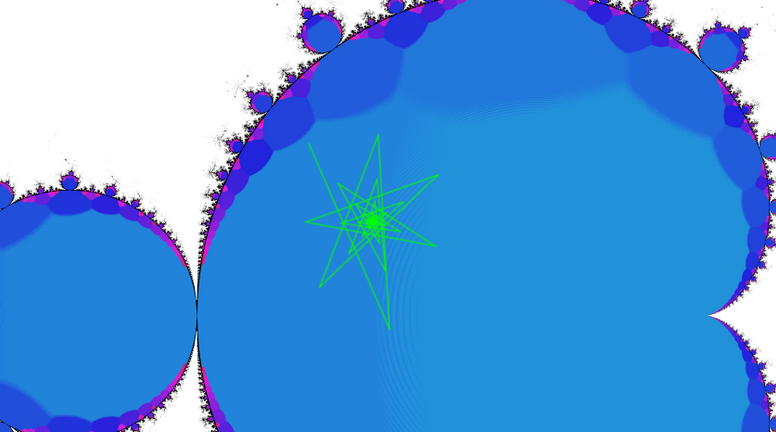
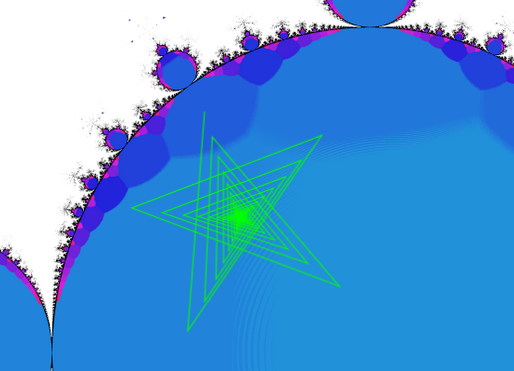
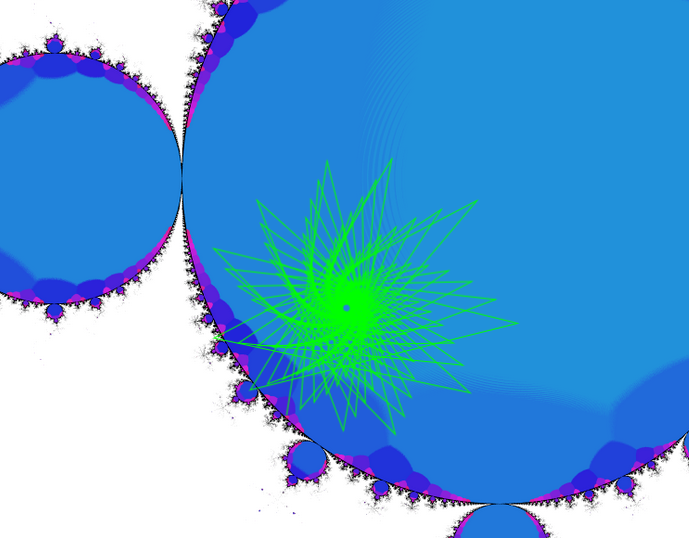
When complex numbers are multiplied, they appear to rotate on the complex plane. Tracing the trajectories can lead to cool shapes - spirals and stars.
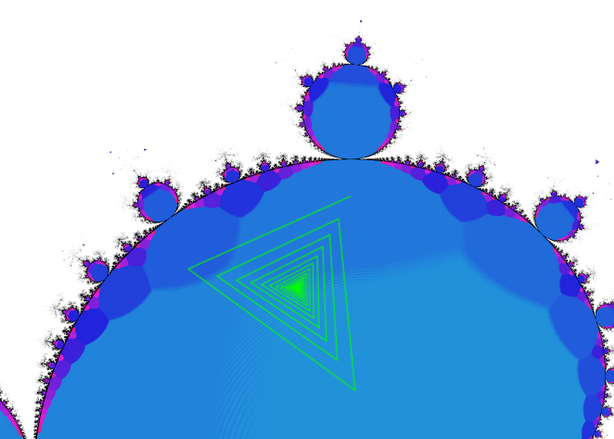
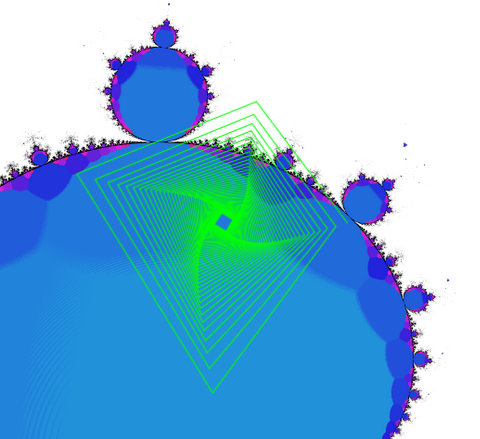
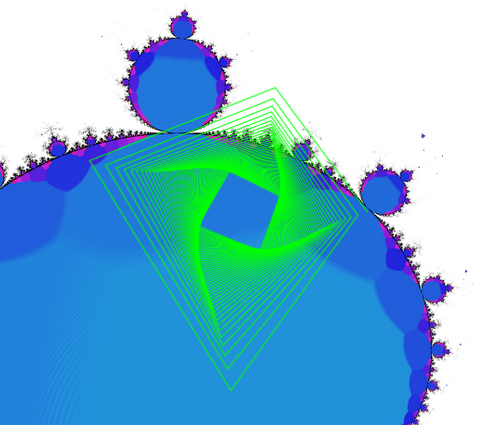
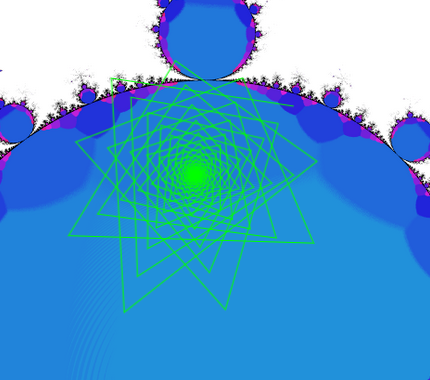
Play around with these shapes yourself down below.
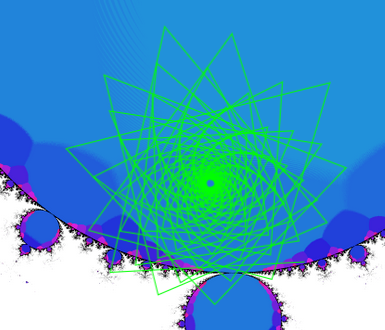
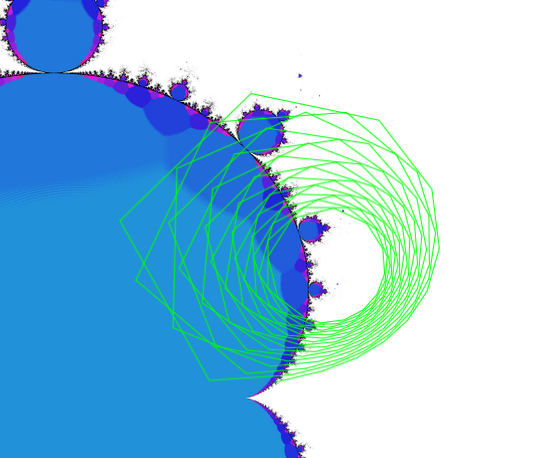
How many points do these spirals/stars have based off of their starting location?
When investigating algorithms to identify periods of orbits in the Mandelbrot I came up with an algorithm that can quantify apparent "shapes". Below is an interactive plotter of the Mandelbrot as well as the color swatches corresponding to how many points to expect, roughly. In a region colored as a "5", you will see a 5-pointed star when plotting trajectories starting near the center of the region - points not near the center won't be quite as clean.